
Simulation Outputs
The result of a successful P90 uncertainty analysis request is an UncertaintyResult, which provides comprehensive statistical analysis of photovoltaic system performance under uncertainty.
Result Structure
Section link: Result StructureAn UncertaintyResult consists of two main components:
- SummaryResult: Statistical analysis including percentile values, histograms, and deviation metrics
- UsedInputsResult: Complete record of all input parameters used in the simulation
These components together provide both the analytical results and full traceability of the simulation configuration used to generate those results.
SummaryResult overview
Section link: SummaryResult overviewThe SummaryResult contains three key statistical components that characterise the uncertainty analysis:
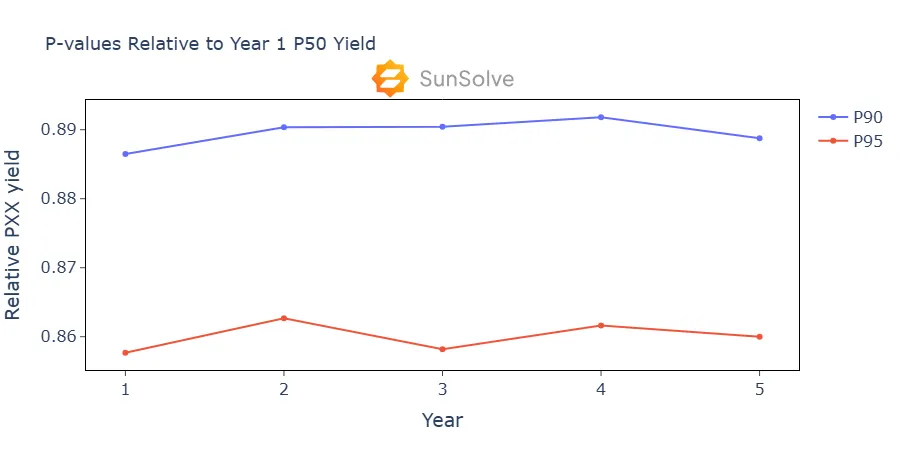
YearlyPValue
Section link: YearlyPValuePercentile values for each simulation year showing exceedance probabilities. For example, P90 represents the yield value that will be exceeded 90% of the time, providing conservative estimates for financial modelling.
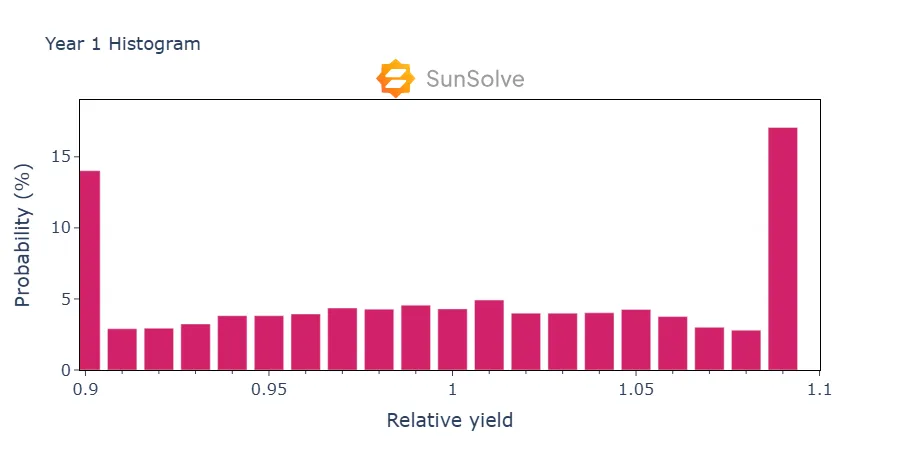
YearlyHistogram
Section link: YearlyHistogramProbability distributions showing the frequency of yield outcomes across all Monte Carlo simulations. These histograms reveal the shape and spread of uncertainty for each year.
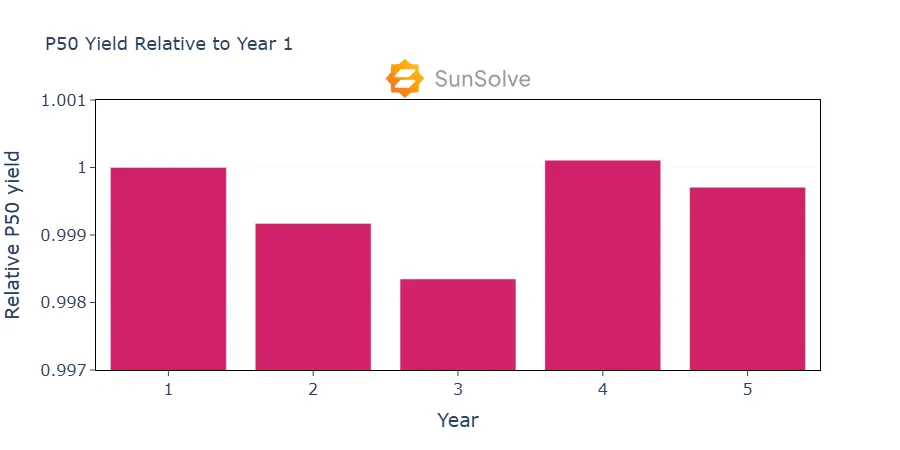
YearlyP50Deviation
Section link: YearlyP50DeviationDeviation metrics expressing each year’s median (P50) yield relative to the first year, capturing the effects of system degradation over time.
Result Processing
Section link: Result ProcessingResults are returned as a tuple with SummaryResult first, followed by UsedInputsResult. Progress updates are provided during Monte Carlo simulation execution.
This structure enables validation of both inputs and outputs for debugging and reproducibility.