
Module population from distributions
With the modifiers scope set to Module population and the Distribution source set to Parameterised distributions, SunSolve Power builds many modules whose cells are drawn at random from statistical distributions. Rather than a single result, the run produces a distribution of module outputs.
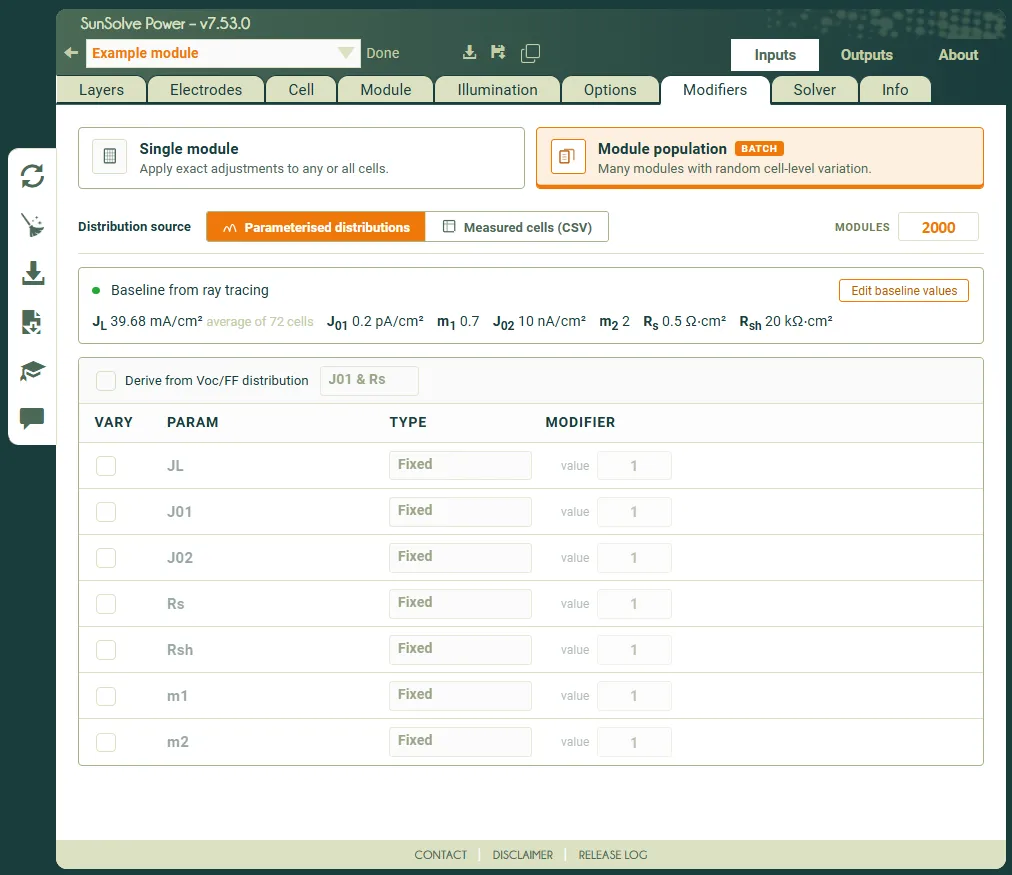
Each parameter is sampled independently for every cell, so the distributions are uncorrelated.
Setting the population size
Section link: Setting the population sizeThe Modules field on the toolbar sets how many modules are built for the population. It accepts values from 130 to 5000 and defaults to 2000; a cleared or zero entry resets to the default, and out-of-range entries are clamped into that range. A larger population resolves the tails of the output distribution more finely but takes longer to solve.
Defining distributions per circuit
Section link: Defining distributions per circuitEach circuit has its own section. Within a section, the parameters are laid out in a grid with four columns:
- Vary: a checkbox that enables the parameter. Cleared parameters are held at their baseline value.
- Param: the equivalent-circuit parameter symbol. Only parameters that are enabled in the base circuit appear.
- Type: the distribution to draw the parameter’s multiplier from. See next section for more details on the options.
- Modifier: the fields that parameterise the chosen distribution.
Enable a parameter with its Vary checkbox, choose a distribution Type, then enter the distribution’s fields under Modifier. All values are multipliers over the circuit’s baseline.
Distribution types
Section link: Distribution typesFour distribution types are available for each parameter:
- Fixed: a single constant multiplier (one value field). This applies the same offset to every cell without introducing any spread.
- Gaussian: a normal distribution defined by its mean and std dev.
- Tophat: a uniform distribution between a min and a max.
- Lognormal: a positively skewed distribution defined by its arithmetic mean and std dev. It keeps every sampled multiplier positive, which suits the diode saturation currents (J01, J02).
The exact sampling equations are given in modifier distributions.
Deriving distributions from Voc and FF
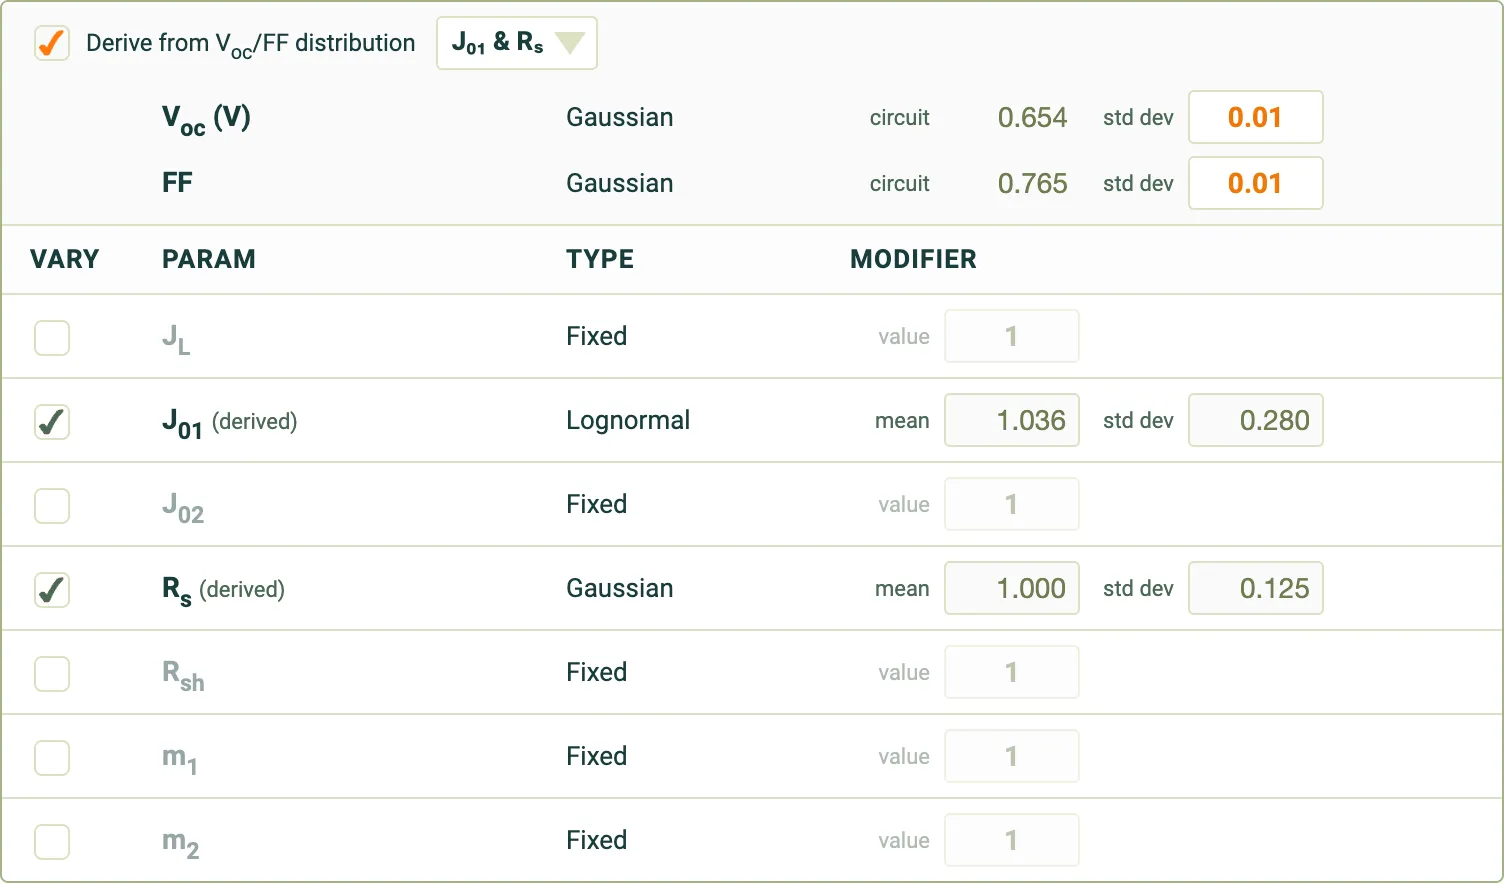
Section link: Deriving distributions from Voc and FFYou may know the spread of open-circuit voltage (Voc) and fill factor (FF) you want to model rather than the spread of the underlying diode parameters. In this case SunSolve allows the definition of a target distribution that can be fit with either a combination of J01 and J02 or J01 and Rs.
To do this:
- Enable Derive from Voc/FF distribution.
- Choose which parameters to solve for with the target selector: J01 & J02 or J01 & Rs.
- Enter the target distributions in the Voc (V) and FF rows. Each is a Gaussian whose mean is fixed at the nominal value the circuit currently produces, shown beside the row as circuit followed by the value, so you enter only the std dev.
- The two derived parameters are then fixed by the calibration and are shown as read-only rows labelled (derived); the remaining parameters (for example a JL distribution) can still be authored directly.
If the requested combination cannot be reproduced for a circuit, the derived rows report The requested Voc/FF target could not be achieved for this circuit; widen or adjust the targets in that case. The derivation is described in full in modifier distributions.
Previewing the population
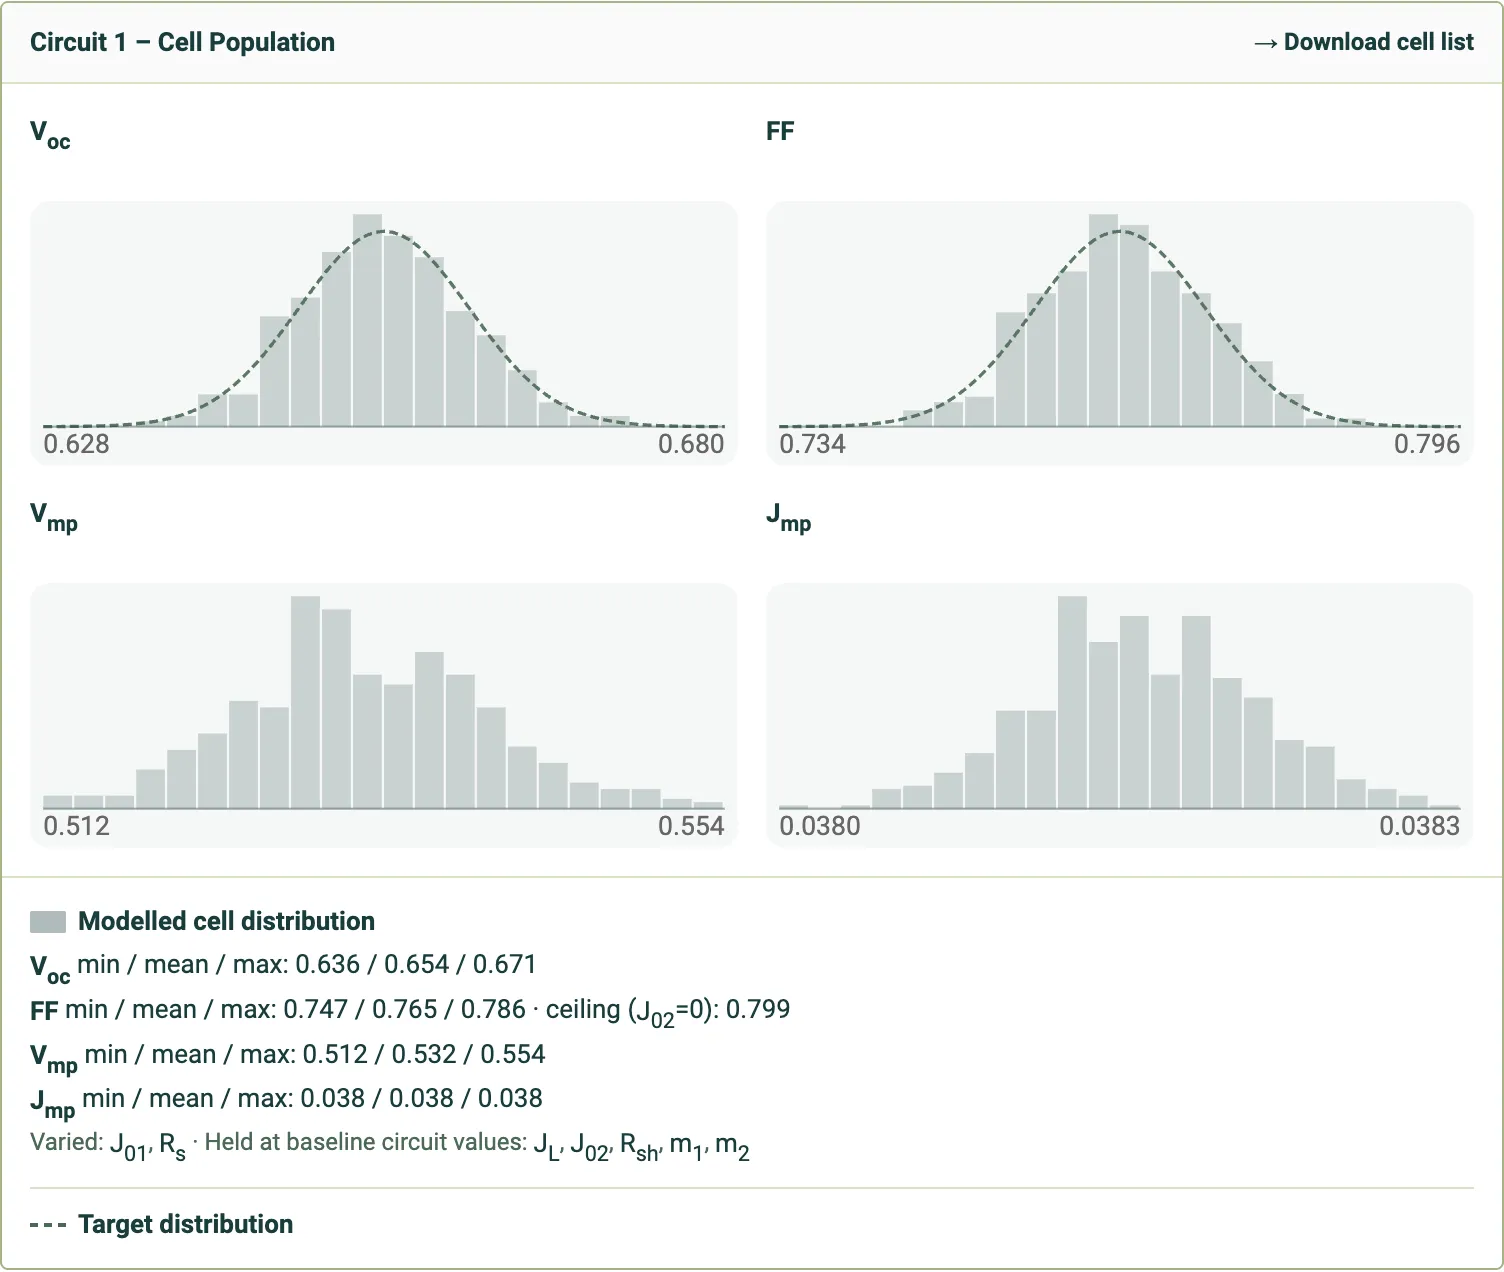
Section link: Previewing the populationAs you edit the distributions, each circuit section shows a Cell Population preview of the sampled cells, computed in the browser without a server round-trip. Use the preview to sanity-check that the spread and central value match your intent before running the full simulation. The preview is an approximation for interactive feedback; the authoritative electrical result comes from the backend solver when the simulation runs.
The preview contains:
- Histograms: four histograms of the sampled cells, for Voc, FF, Vmp and Jmp.
- Display target: a checkbox, shown when Derive from Voc/FF distribution is enabled, that draws the target Voc and FF distributions as dashed curves over the histograms so you can compare the sampled cells against them.
- Modelled cell distribution: the minimum, mean and maximum of each metric, with the FF ceiling (the highest FF the population could reach with J02 set to zero).
- Varied and held parameters: a line naming the parameters you are varying and those held at the baseline circuit values.
- Download cell list: saves the sampled cells as a CSV file, including the reason for each cell the preview rejects. When some sampled cells are rejected, the preview reports how many.
Until ray tracing has run, the preview shows Awaiting ray tracing in place of the histograms.
Reading the results
Section link: Reading the resultsRun the simulation, then open the distribution results output page to read the module-power and mismatch-loss distributions, compare metrics, and download the per-module population.
For a worked end-to-end example, see how to model module mismatch from parameterised distributions.