
Distribution results
When modifiers are run as a module population, the Distribution tab shows the spread of results across the population rather than a single value. This page describes how to read it.
The tab shows “Please run the simulation first to view the distribution.” until the upstream optical and electrical solve has produced a per-cell result. Once it has, the population runs automatically. The round button at the top left of the tab stops a run in progress and starts it again afterwards, and the summary line beside it reports the number of samples so far.
Headline metrics
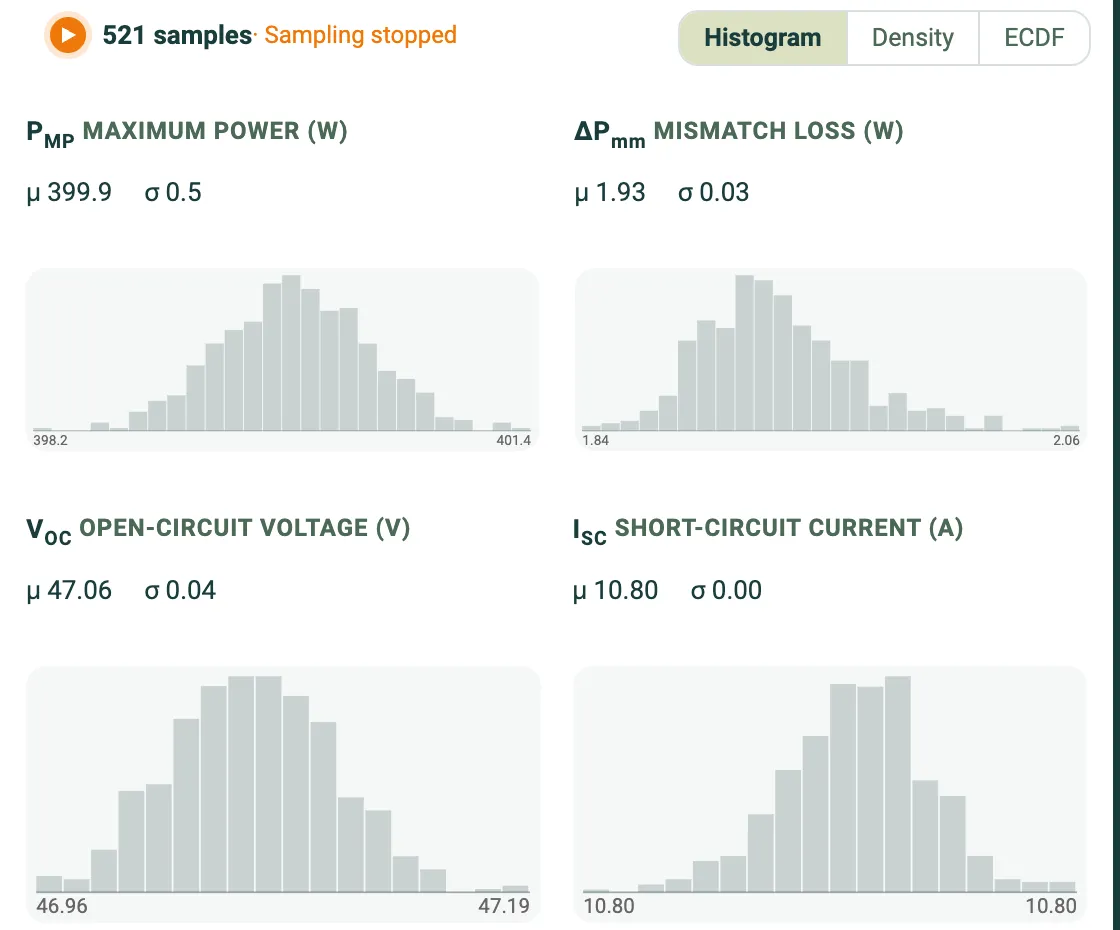
Section link: Headline metricsTwo headline cards summarise the population: Maximum power and Mismatch. Each reports the central value and spread across all modules, giving the module-power distribution and the mismatch-loss distribution at a glance.
Distribution views
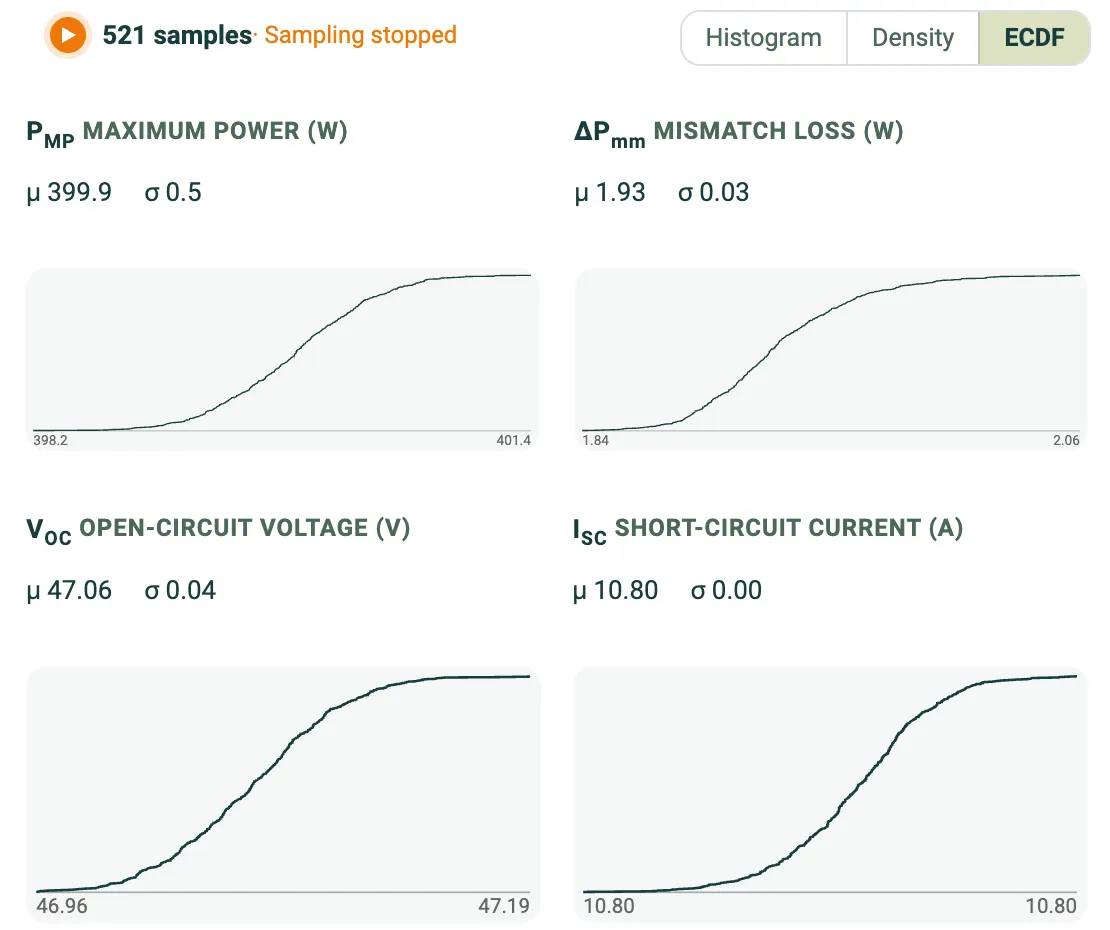
Section link: Distribution viewsA grid of histograms shows the distribution of each output metric. The view switch above the grid changes how each distribution is drawn:
- Histogram: counts per value bin.
- Density: a smoothed estimate of the same distribution.
- ECDF: the empirical cumulative distribution, for reading percentiles directly.
Per-bin comparison
Section link: Per-bin comparisonWhen the population is built from a binned measured-cell file, a card below the grid plots a single metric for each cell bin, with the cell bins along the Cell Bin axis. Choose the metric from the dropdown, and the plotting style with the mode control:
- Auto selects a style from the bin count.
- Raincloud, Box strip and Heatmap force a specific style.
Click a bin to filter the population to it, click further bins to add them, or drag across a range of bins to select them all. The filter bar above the plot reports the selection, for example “Filtered to cell bin LARGE”, and Clear filter removes it. Populations without cell bins have no per-bin card.
Modules that fail to solve
Section link: Modules that fail to solveOccasionally a module in the population cannot be solved, usually because its cell parameters put the electrical solver outside the range it can converge on. Those modules have no metric values, so they contribute to no statistic and have no point on any chart: they are left out of the headline figures, the value bins of every histogram, and the per-bin plot.
They are still counted and reported, in three places:
- The summary line above the grid adds a failed count next to the sample count. Click that count to list only the failed modules in the table, and click it again to bring the solved ones back.
- Each histogram gains a Failed column, drawn past a dashed break to the right of the value axis because these modules have no value to bin. It is the same width as the value bars and is labelled vertically above it. The column shares the bars’ count scale, so its height is comparable with the bars beside it but not with the same column on another chart, each chart being scaled to its own tallest bin. Click it to highlight the failed modules, exactly as you would a value bin.
- The module table lists them below the solved modules, whatever the sort order, with the solver’s error message in place of the metrics. Failed rows cannot be clicked, because there is no point on any chart to highlight in return; highlight them from the Failed column or the failed count instead.
A cell-bin filter applies to the failed modules too, so both the failed column on the charts and the failed rows in the table narrow to the bins you have selected.
The sample count therefore reports the modules that solved, not the size of the population you requested. A run finishes when every module has either solved or failed.
Module table and download
Section link: Module table and downloadA table lists the individual modules in the population and can be sorted by any metric to find the best and worst modules. Use Download module population to csv to export the per-module results for further analysis. When any module has failed, the export gains an Error column, and the failed modules appear as rows with blank metrics and their error message.