Ray tracing methodology
SunSolve applies stochastic ray tracing to solve the annual yield. It traces (i) the isotropic-sky condition, and (ii) the direct beam condition for a discrete number of solar locations (covering just those solar locations that are relevant for the site). A three-point interpolation of those locations is then used to determine the direct-sky optics for the exact solar location at each timestep of the year. Additionally, it solves the performance of the module as if it were tested with standard test conditions (i.e. on a solar simulator commonly referred to as an IV tester).
SunSolve traces the rays until either they are absorbed by an optical component (e.g., the ground, the module frame, a solar cell) or they are returned to the sky. The rays absorbed within the silicon of each cell are summed to give the absorbed photon current and thence the light-generated current. This is performed over the wavelength range, 300–1200 nm, in 20 nm intervals. The light-generated current in each cell is then used by the SPICE solver to determine the IV behaviour of each module.
The simulations account for wavelength dependencies, thin film optics, textured surfaces, polarization and scattering, thereby avoiding many assumptions required by view-factor or mathematical models. That is, unlike those models, it accounts for secondary reflections, angular responses, and shading and reflection from the torque tube and frames.
Reference equations and concise model definitions are in the Fundamental optics page
Ray tracing algorithm
Section titled “Ray tracing algorithm”SunSolve combines Monte Carlo ray tracing with thin-film optics and follows the following general procedure:
-
A number of rays (the value specified by the advanced input ‘Rays per packet’) are created. Each ray is assigned a wavelength, an intensity, a direction, and a location,
-
For STC module solving the location is either above the module for front illumination or below the module for rear illumination,
-
During yield solving the location is positioned at the top (i.e., above) of the unit-system
-
-
Each light ray proceeds along a straight line until it intersects with an interface, such as the front or rear surface of a module, of system structure or with the ground.
-
At this interaction, and at all future interactions with an interface,
-
reflectance, transmittance and absorptance are calculated, where the value of each depends on the wavelength λ and the electric field (polarisation), as well as on the complex refractive index of the materials on either side of the interface and any thin films that lie between them;
-
the intensity of the ray is reduced by the value of the absorptance;
-
the magnitudes of reflectance and transmittance are translated into probabilities;
-
a random decision, weighted by those probabilities, is taken to select whether to reflect or transmit the ray at the interface;
-
a new direction is calculated and ascribed to the ray depending on whether the ray is reflected or transmitted, and on the scattering model assigned to that interface;
-
the ray continues passing through the module until it intersects another interface.
-
-
If the ray passes through an absorbing layer, its intensity is reduced by applying Beer’s law. This reduction in intensity is usually considered as a loss (e.g., due to absorption in the glass of a module), but when the ray passes through a semiconductor like silicon, the absorption can equate to the photogeneration of electron–hole pairs and therefore the reduction in intensity can be considered as a gain.
-
Steps 2–4 are repeated for each ray until
-
the ray is lost from the system by being reflected to the sky;
-
the ray’s intensity decreases below a threshold (the default is 0.01%); or
-
the ray has intersected with the maximum allowable number of interfaces (the default is 1000).
-
-
During the ray tracing process any absorption within the solar cells of each module in the scene is recorded. This is stored as a function of wavelength in two separate lists for front and rear absorption.
-
Steps 1–6 are repeated for as many ray packets that are required for the total number of rays (the value specified by the input ‘Rays per solar angle’). The total gains and losses are averaged and sent to the user interface.
-
This entire procedure is repeated for as many solar angles as needed to solve the requested period of the energy yield.
Ray tracing at the system level occurs within a box defined by the unit-system (see section 7). Rays are always generated at the top of the box. Any ray that strikes the side walls of the unit-system keeps the same direction and intensity, but has its location translated to the opposite boundary of the unit system. This has the effect of simulating an ‘infinite field’ made up of unit-system blocks. This is represented in the figure as ghost modules. The image only shows a finite number of rows and ghost modules, however within the simulation this would extend to infinity. Rays that intersect with the bottom of the box are considered to have hit the ground. At this point they are reflected, absorbed, scattered as per the definition of the albedo. Rays that intersect the top of the box are lost to the sky.
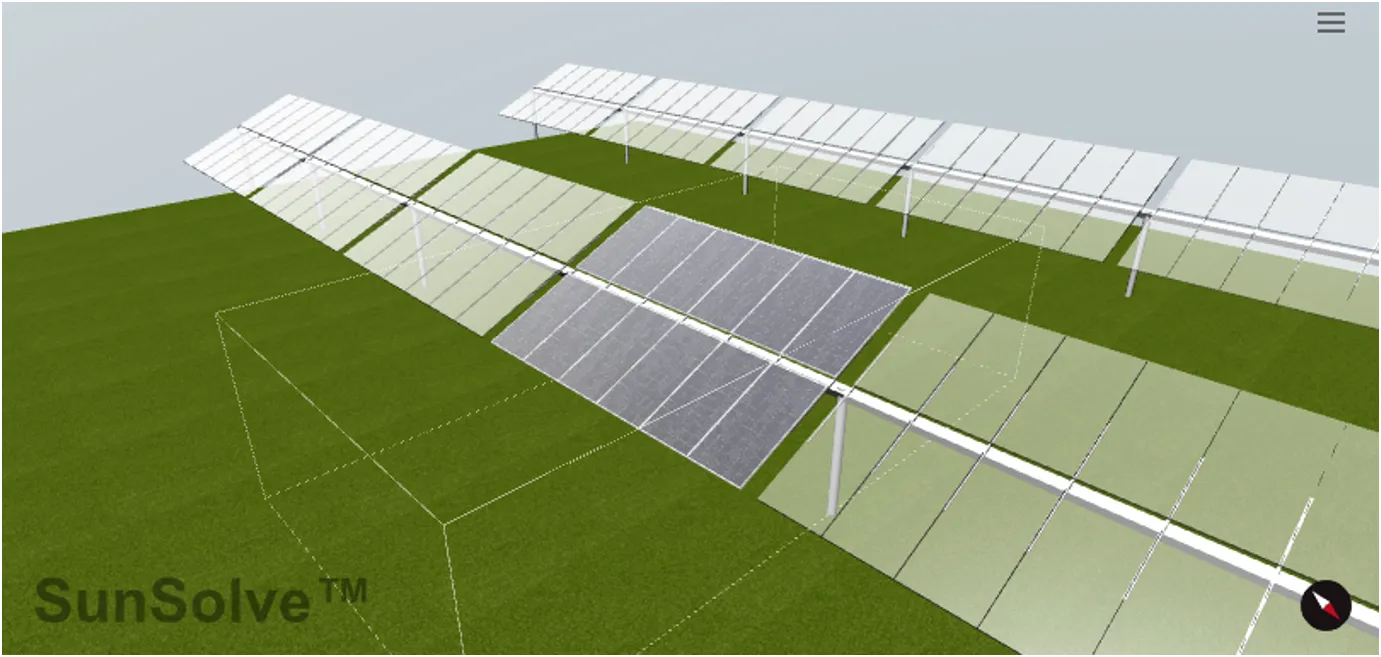 Example of a unit-system (shown as the wire box).
Note that the modules within the scene may absorb light from either the front or rear side. Thus, for bifacial panels the transposition of light onto the front and rear sides are treated in the same way from a ray-tracing perspective and are solved concurrently within the same scene (i.e. there is no separate solution used for front and rear absorption). Noting that the module definition may apply different surface optics for front and rear sides (e.g. the front glass may have an anti-reflection coating whilst the rear does not). As described in step 6 of the algorithm, the front and rear wavelength dependent absorption is recorded in separate lists. This allows the electrical solver to apply different responses depending on the source of the irradiance (e.g. the quantum efficiency of the panel may be higher for front side absorption).
Solar arcs
Section titled “Solar arcs”During an annual yield simulation, the sky is divided into a number of solar locations based on all possible locations of the sun throughout the year. SunSolve then ray traces all of those solar locations to compute the optical behaviour of the system, and these are appropriately combined to solve the system optics at each hour of the year. For example, if at a certain hour, the sun is at a location (θ, φ) = (46°, 128°), we then find the ray-tracing solutions for the three locations nearest to that point, which might be (45°, 120°), (48°, 130°), and (50°, 125°). We take those three solutions and perform 2D linear interpolations to estimate the system optics at the desired location of (46°, 128°).
The choice of solar locations to solve is defined by two inputs, the first is the number of paths across the sky (number of arcs), the second is the number of points on that path that are solved (points per arc). It is necessary to optimise these inputs to minimise error without requiring impractical computation times. The main source of error arises when the sun is low in the sky such that the nearest points have differing degrees of row-to-row shading of direct light. This problem is more pronounced in fixed systems than in single-axis trackers (SATs); SATs employ backtracking which prevents row-to-row shading of direct light.
Rays per solar angle
Section titled “Rays per solar angle”Each solar angle is solved with a discrete number of rays as determined by the ‘Rays per solar angle’ input. This value may either be entered directly, or automatically set based on the equation below:
A larger number of rays results in greater simulation accuracy but a longer time to solve. If the value is too large, and as a result the solution time requires longer than 15 minutes, then the simulation will fail. Running too few rays results in greater error in the distribution of absorption within the cells relative to the other cells and to the surrounding environment.
See the Stochastic error page for more detail on how ray count impacts module output.
Rays per packet*
Section titled “Rays per packet*”During ray tracing the total number of rays (max rays per solar angle) is split into smaller groups (packets) for solving. This is defined by the ‘Rays per packet’ In SunSolve Yield this value is automatically set to a value of 50,000.
Selection of the value is a trade-off between performance1, accuracy2, and server-side hardware limitations. Aggregation based on separate packets also enables the standard deviation of the result to be calculated which can be used as a metric to indicate a desired level of convergence.