Summary Result
The SummaryResult contains the core statistical analysis from the Monte Carlo uncertainty simulation, providing percentile values, probability distributions, and deviation metrics.
summary.YearlyPValuesummary.YearlyHistogramsummary.YearlyP50DeviationYearlyPValue
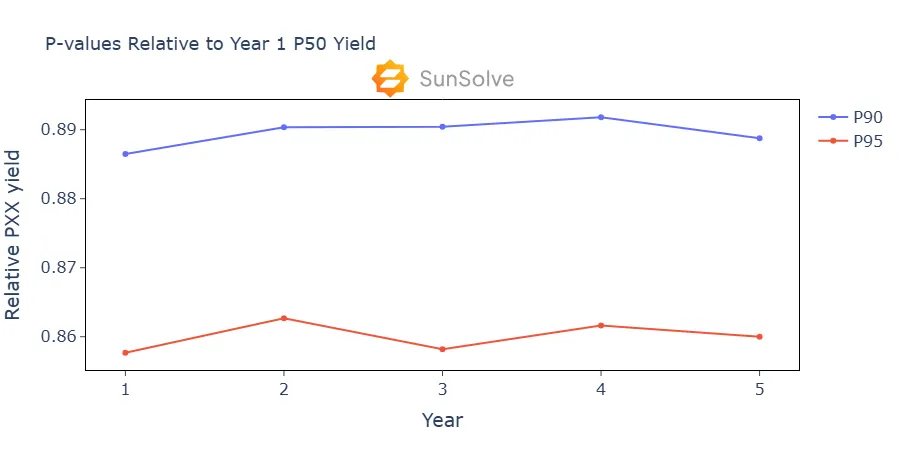
Section titled “YearlyPValue”Percentile values calculated for each year of the simulation, representing exceedance probabilities for energy yield.
Structure:
Year: Simulation year (1-based indexing)P: Percentile value (e.g., 50 for median, 90 for P90)P50Deviation: Ratio relative to that year’s P50 (median) value
Example:
YearlyPValue { Year: 1 P: 90 P50Deviation: 0.7706670856200547}Interpretation: A P90 value with P50Deviation of 0.77 indicates the P90 yield is 77% of that year’s median (P50) yield, representing the conservative estimate used for financial modeling.
YearlyHistogram
Section titled “YearlyHistogram”Probability distribution of yield values represented as histogram bins for each simulation year.
Structure:
Year: Simulation year (1-based indexing)Bins: Array of frequency counts for each histogram bin
Example:
YearlyHistogram { Year: 1 bins: [3, 0, 0, 0, 0, 0, 2, 0, 0, 3, 2, 1, 1, 3, 4, 3, 4, 7, 6, 10, 14, 6, 11, 20, 12, 16, 20, 25, 33, 37, 33, 50, 37, 47, 56, 63, 57, 67, 74, 58, 51, 54, 46, 19, 18, 12, 8, 2, 3, 2, 0, 0, 0, 0, 0, 0, 0, 0, 0, 0, 0, 0, 0, 0, 0, 0, 0, 0, 0, 0]}Interpretation: Each bin represents the frequency of simulation results falling within that yield range. The bin boundaries are defined by BinMin and BinDelta parameters from the simulation settings. Higher frequencies in lower bins indicate higher probability of conservative yield estimates.
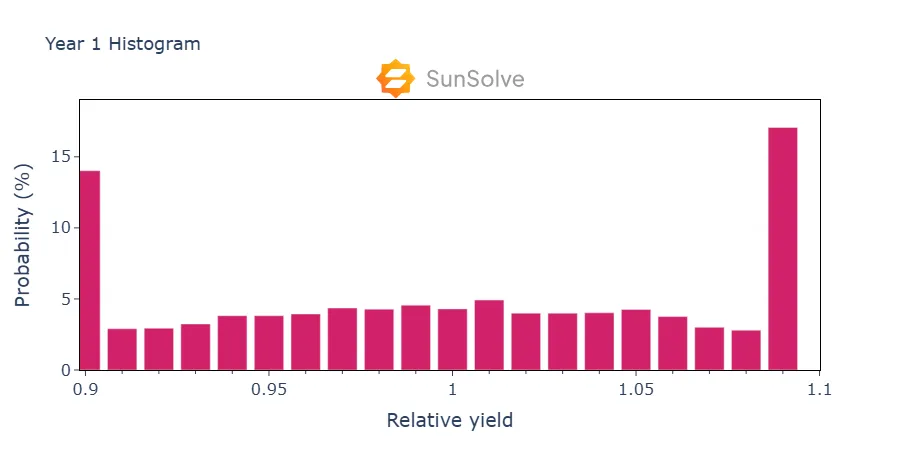
Histogram notes:
- First and last bins include all values to their left and right, respectively
- Bins capture the distribution of yield outcomes across all simulations
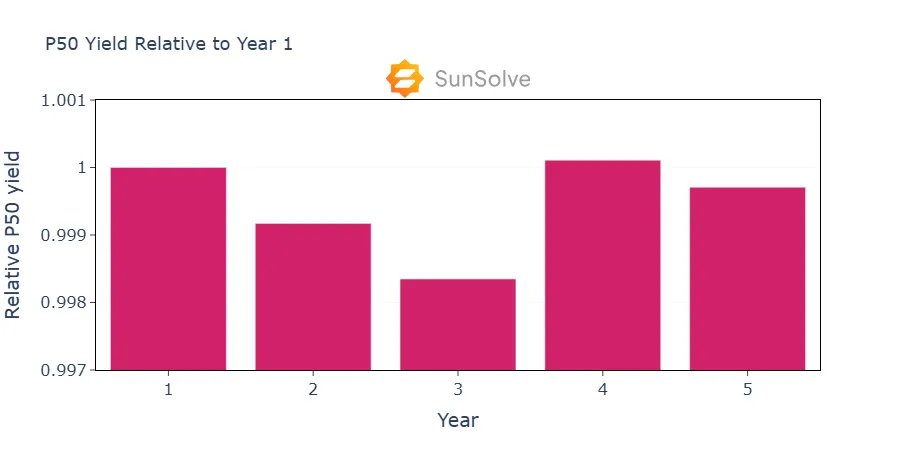
YearlyP50Deviation
Section titled “YearlyP50Deviation”P50 deviation metric for each simulation year, expressed relative to year 1’s P50 value.
Structure:
Year: Simulation year (1-based indexing)Value: Deviation value relative to year 1 P50 (typically 1.0 for year 1)
Example:
YearlyP50Deviation { Year: 1 Value: 1}Usage: Shows how each year’s P50 value compares to the first year’s P50 as a baseline reference. Values less than 1.0 indicate degradation effects over time.